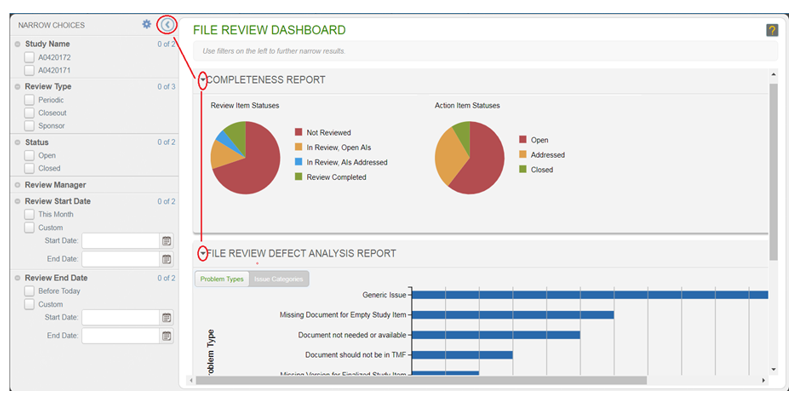
The File Review Dashboard provides an at-a-glance view of File Review progress in a visually robust and interactive display. The dashboard contains three sections:
- Completeness Report
- File Review Defect Analysis Report
- Filters Panel
Each section can be hidden to enlarge the display of the other sections, as shown below.

The Completeness Report section of the dashboard shows two pie charts-one for Review Items and one for action items. Each pie chart shows the proportion of existing items in different statuses. If you hover over a portion, a tool tip displays the actual number of items in the status and its relative percentage to the whole. This information enables you to take action or investigate further where needed.
The Defect Analysis Report section initially displays a bar chart of Action Items by Problem Type. This allows you to see the types of issues that are occurring most frequently. If you hover over a particular bar on the chart, a tool tip displays the specific number of Action Items in the File Review with that issue. Use the toggle to display a bar chart of Action Items by Issue Category. By switching to the Issue Categories view, you can view issues at a more granular level.
The Filters panel allows you to limit the information displayed by facet. For example, you can select to view File Review information for a specific study, Review Type or Review Manager.
A user with at least TMF View File Reviews permissions and who has access to at least one File Review* can view content within the File Review Dashboard.
To view the dashboard, select the “File Review Dashboard” option from one of the following menus:
- File Reviews List Page Actions Menu
- File Review Actions Menu
- Review Items List Page Actions Menu
- File Review Reports
*Access to specific File Reviews is controlled by the groups specified in each File Review Template.
