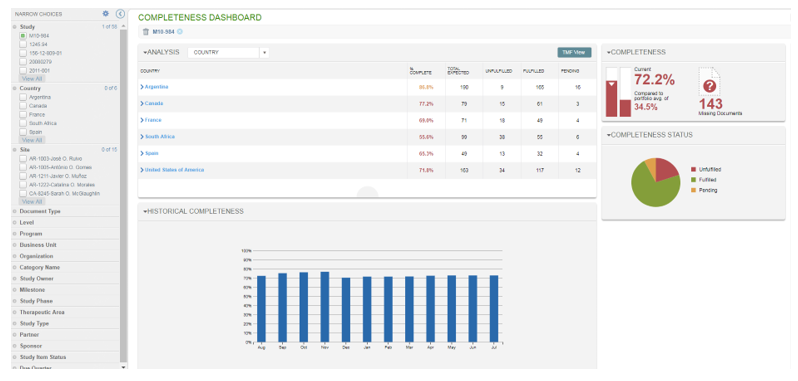
The Completeness Dashboard displays detailed information on whether or not required documents have been received within various interactive charts and tables.

When accessed from the User Home Page, the dashboard displays information for a single study; when accessed from the Metrics area of eTMF, the dashboard displays information for all studies. You can filter the dashboard to display only the information you need by using the values that appear in the Narrow Choices Panel on the left.
You can collapse the Narrow Choices Panel (and expand the display of charts and tables) by selecting the left-facing arrow at the top of the panel. In addition, you can collapse any of the dashboard areas by selecting the down arrow next to the area’s title.
Use the icon at the top right of the page to export the dashboard information to an Excel file. You can access the Excel File from the Downloads area of eTMF. Note that if there are more than 32,000 results to export, only summary information from the charts will be included in the export file; report details will not be included.
Completeness Status
The Completeness Status area of the dashboard displays a pie chart which breaks down the percentage of Unfulfilled, Fulfilled, and Pending documents relative to the total number of documents to be received. If you hover over a section of the chart, a tool tip displays the number of documents with the status and the percentage of total it represents.
Analysis
The Analysis area allows you to view the total number of documents to be received and a breakdown of the total by status (Unfulfilled, fulfilled, and pending). The data can be grouped using the selections in the Analysis drop-down. This example above shows grouping by country. If you select a country from the table in the example above, the dashboard filters to show only relevant data for that country.
If the Dashboard is filtered to only one study, you may select the “TMF View” button to view the Study Item List.
Completeness
The Completeness area of the dashboard contains a bar chart that shows the current completeness percentage (# of fulfilled study items with a due date before the current date/# of study items with a due date before the current date) compared to the portfolio average (i.e., the combined completeness metric for all studies you have access to). The total count of missing documents is also displayed in this section, allowing you to easily see how many documents are needed to be 100% complete.
Historical Completeness
The Historical Completeness area allows you to view a graphical representation of the percentage of documents completed for each month within the past year. Hover over each month to view the percentage.
