The Timeliness Dashboard displays detailed information on the amount of time it takes for documents to process through QC within various interactive charts and tables.
eTMF uses the following criteria in timeliness metrics and reports:
- Documents that are not authored
- Documents whose study has Include in Metrics = Yes.
- Documents that are Unblinded, Final, Obsolete, or Superseded
- Documents for studies the user has access to
- User selected criteria.
Calculation
The current Timeliness metric is calculated using the following equation:
% Timeliness = [(#documents finalized within X days of their receipt date/ #documents finalized) X100], where X is the acceptable threshold after the document receipt date.
The current is displayed alongside the portfolio average, which is defined as the combined timeliness metric of all the studies to which the user has access.
Note: Because the calculation considers all document versions, your timeliness metric may be affected by document revisions made after finalization. To prevent this, you can exclude document revisions from the timeliness dashboard. In the Narrow Choices panel of your dashboard, click the checkbox Yes under Exclude Document Revisions.
Timeliness Dashboard Fields
Analysis
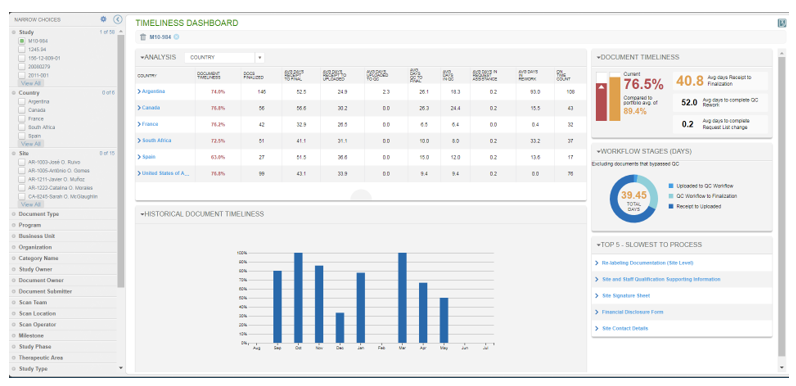
The Analysis area allows you to view a breakdown of the time documents spend in particular statuses. The data can be grouped using the selections in the Analysis dropdown. The image above shows grouping by country. If you select a grouping from the table, the dashboard filters to show only relevant data for that grouping.
Document Timeliness
The Document Timeliness area displays the current timeliness compared to the portfolio average (i.e., the combined timeliness metric for all studies you have access to). You can view the average number of days it has taken a document to be finalized, to complete QC Rework, and to complete Request List Change.
Historical Timeliness
The Historical Timeliness section contains a bar chart that displays the percentage of documents that were finalized within the configured timeliness metric for each month within the past year.
Top 5
The Top 5 area shows the top slowest to process Document Types for the selected data set. Selecting Document Type will add it to the set of filters applied.
Workflow Stages
The Workflow Stages area displays a doughnut chart that provides a more detailed look into the workflow stages of documents. You can hover over a section to view the average days it takes documents to process through the selected workflow stage. In the center of the chart, the average number of days it takes documents to process from receipt to finalization is displayed.
Workflow Stages Bypassed QC
The Workflow Stages Bypassed QC area displays a doughnut chart that examines document timeliness for documents that have bypassed QC. You can hover over a section to view the average days it takes documents to process through the selected workflow stage. In the center of the chart, the average number of days it takes documents to process from receipt to finalization is displayed.
Access and Modify your Timeliness Dashboard
To view the timeliness dashboard from your Study Homepage:
In your study homepage, click the Actions icon, then select Reports and Dashboards > View Timeliness Dashboard.
To view the timeliness dashboard for all studies:
Click More in your Global Header then select Dashboards > View Timeliness Dashboard
To modify your dashboard view:
Filter the dashboard by selecting any of the filter facets in the Narrow Choices panel.
Collapse the Filters Panel (and expand the display of charts and tables) by selecting the left-facing arrow Show/Hide Filters.
Collapse any of the dashboard areas by selecting the down arrow next to the area’s title.
To export your dashboard information:
- In your Dashboard, click the Export to Excel icon.
- Click the More actions icon in the global header, then select View Downloads.
- Click your report.
Note: that if there are more than 32,000 results to export, only summary information from the charts will be included in the export file; report details will not be included.
